
The Strait Did Not Reopen the System
Re:Doubt Dispatch- 001
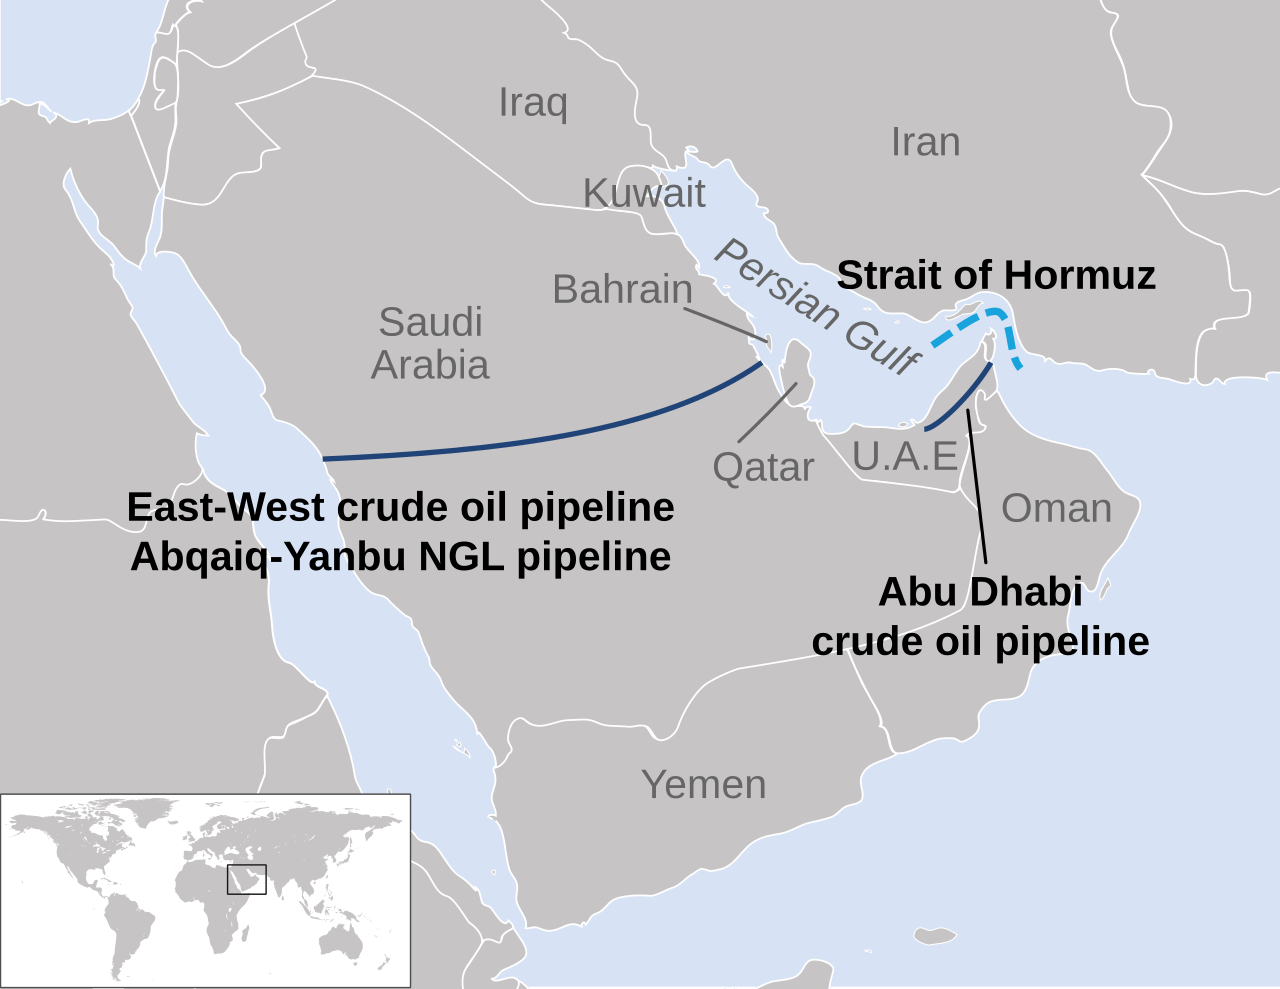
The Strait of Hormuz and the principal crude-oil bypass routes available to Saudi Arabia and the United Arab Emirates. The map illustrates why alternative capacity exists but cannot fully substitute for normal traffic through the Strait. Source: Wikimedia Commons, CC0.
The first mistake is to treat the Strait of Hormuz as a binary: open or closed, crisis or relief, panic or normalization. That is how markets prefer to read geography.
It is not how material systems recover.
The Strait is not merely a lane on a map. In 2025, nearly 20 million barrels per day of crude oil and oil products moved through Hormuz, equal to roughly a quarter of world seaborne oil trade.[1] Qatar and the United Arab Emirates sent liquefied natural gas through the route in volumes equal to almost one-fifth of global LNG trade.[1] Saudi Arabia and the UAE can bypass the Strait for some crude, but the IEA estimates only 3.5 million to 5.5 million barrels per day of available alternative capacity, and the logistics required to use it at scale have not been robustly tested.[1] There is no alternative export route capable of carrying Qatari and Emirati LNG to global markets.[1]
That is why the language of reopening is analytically dangerous. The interim agreement reached in mid-June allowed partial tanker flows to resume.[2][8] The IEA reports that global oil supply rebounded by 4.1 million barrels per day in June, to 98.8 million, but remained 9.4 million barrels per day below pre-war output.[2] Total Gulf oil exports, including flows using bypass routes, climbed to 16.1 million barrels per day but remained well below the pre-war average of 24 million.[2]
However, the more important signal is not crude. It is products. Refined-product cracks — the spread between fuel and crude prices — and refinery margins reached four-year highs in early July because crude availability recovered faster than refinery operations and product supply.[2] Gulf exports of refined products and liquefied petroleum gas in June remained below half their pre-war level, while loadings from key Gulf export refineries had yet to resume.[2] The IEA described the result as a “disconnect between apparently well supplied crude oil markets and tight product markets.”[2] Crude can look loose while usable fuel stays tight.
Material resilience has a concrete meaning here. Gulf producers exported 3.3 million barrels per day of refined products and 1.5 million barrels per day of LPG in 2025.[3] The IEA reported that the steepest losses from the disruption had occurred in petrochemicals, where feedstock availability had become increasingly constrained.[3] That pressure reaches well beyond fuel. Petrochemicals are embedded in plastics, fertilizers, packaging, clothing, digital devices, medical equipment, detergents, tires, building insulation, batteries, and electric-vehicle parts.[4] This is what a chokepoint does at system scale. It creates a pathway from an energy disruption into a goods-economy repricing, then hides that pathway until the resulting pressure appears in a sector the headline never mentioned.
This is the Re:Doubt point. Confidence can reprice faster than infrastructure can recover. As optimism built around the mid-June agreement, crude returned toward pre-war levels while international gasoline and diesel prices remained around 30 percent higher than before the war.[5] The benchmark moved. The downstream shock kept traveling. The gap persisted precisely during the optimism.
Even that confidence trade was provisional. North Sea Dated crude fell to about $68 per barrel by early July, then returned to about $77 after the ceasefire was breached on July 7–8.[2] Kpler counted 25 Strait crossings on 8 July, below the recent daily range of 30 to 50.[6] Separate ship-tracking data showed at least four oil and gas tankers turning back following attacks on commercial vessels.[7] The reopening was real. It was partial, conditional, and already unwinding.
The official outlook still assumes a path back. The EIA’s July outlook (completed on 1 July, before the renewed escalation) expects most crude production and trade patterns to return near pre-conflict levels by year-end, Brent to average about $74 per barrel in the third quarter, and Brent to fall to around $65 in 2027 as production recovers and inventories begin to rebuild.[2][8] The IEA makes the same case more cautiously: its supply forecast is contingent on a swift de-escalation, and its projected return to surplus depends on tanker flows continuing to recover.[2] That is not restored resilience. It is a forecast resting on conditions that have already failed once.
Hormuz matters because it exposes the gap between price confidence and material resilience. A market can erase a war premium before refinery networks rebalance. A government can point to lower crude benchmarks while the shock remains inside international fuel markets and reaches households unevenly through taxes, subsidies, and price controls.[5] Inventories can cushion demand before they reveal how much slack has been consumed: OECD oil stocks fell by 73 million barrels in May and another 62 million in June, including an estimated 44 million barrels released from government stocks.[2] The system has been buying time by consuming its buffer.
Hormuz did not reopen the system. Rather, it briefly reopened the market’s ability to price as though the system had healed. That is the confidence game: movement mistaken for resilience, and partial restoration measured as systemic repair. Confidence returned; resilience did not.
The Re:Doubt Method: Transmission Chain Analysis — tracing the downstream pathway from a visible shock before it resurfaces as a shortage, price move, or political adjustment that appears disconnected from the original cause; applying forensics logic to political economy: follow the flow, not the flashpoint.
Source notes
[1] International Energy Agency, “Strait of Hormuz,” factsheet, last updated February 2026. The factsheet provides the 2025 oil and LNG transit figures, available crude-bypass capacity, the qualification that bypass logistics have not been robustly tested, and the absence of an alternative global export route for Qatari and Emirati LNG.
[2] International Energy Agency, Oil Market Report — July 2026, published 10 July 2026. This is the primary source for the June supply rebound, the 9.4 million-barrel-per-day shortfall, Gulf export volumes, product-market conditions, inventory draws, North Sea Dated prices, the 7–8 July escalation, and the conditional return-to-surplus forecast.
[3] International Energy Agency, “The Middle East and Global Energy Markets,” accessed 10 July 2026. This provides the 2025 refined-product and LPG export figures and the finding that petrochemicals had experienced the steepest losses as feedstock availability became constrained.
[4] International Energy Agency, The Future of Petrochemicals, 4 October 2018. Used only for the structurally stable mapping of petrochemical inputs into plastics, fertilizers, packaging, medical equipment, digital devices, insulation, batteries, electric-vehicle parts, and other manufactured goods.
[5] International Energy Agency, “From Hormuz to the Pump: Why Oil Price Shocks Hit Consumers Differently,” 9 July 2026. This supports the divergence between crude and international gasoline and diesel prices and the differing retail transmission produced by national tax, subsidy, and price-control systems.
[6] Rebecca Feng, “Hormuz Traffic Slows After Ceasefire Breakdown,” The Wall Street Journal live coverage, 9 July 2026, 8:05 a.m. ET, citing Kpler.
[7] Jillian Ambrose, “Oil Prices Rise Sharply After Iran Launches Attacks on Tankers Near Strait of Hormuz,” The Guardian, 8 July 2026.
[8] U.S. Energy Information Administration, Short-Term Energy Outlook — July 2026, released 7 July 2026 and completed 1 July 2026. Used for the production-recovery assumptions, third-quarter Brent forecast, 2027 Brent forecast, and expected inventory trajectory.